Market Intelligence for Industrial AI & Engineering Software
700+ curated companies across CAD, PLM, CAE, simulation, and Industrial AI. Weekly updates. Technical taxonomy maintained by a single domain expert with 35+ years in engineering software markets.
Interactive analytics access only. Raw data extracts and API access are available under Institutional and Advisory engagements.
Access to ThreadMoat
Choose your access scope. All tiers include weekly dataset updates.
Explorer
Scout the landscape — no credit card
Free — 3 interactive views
- Startup Ecosystem Graph — interactive relationship mapping
- ThreadMoat Market Segmentation — 9 domains, category breakdown
- Geography Map — global startup distribution
- Updated weekly with the full 700+ company dataset
Analyst
One report + selected interactive analytics
One-time purchase — single legal entity, internal use only
- All Explorer views plus 10 interactive analytics charts
- Leadership Grid — competitive positioning
- Bubble Chart — multi-dimensional scatter analysis
- Full Landscape — grouped company tiles by category
- Top Rankings — companies ranked by any dimension
- Category Treemap — hierarchical market view
- Founding Timeline — ecosystem evolution
- Industry Sunburst — radial market hierarchy
- One current-quarter Market Intelligence Report included
- 60-min analyst briefing with Michael Finocchiaro
Team
Up to 5 named users
Annual subscription — single legal entity
- All Analyst analytics plus 15 advanced views
- Company Compare — side-by-side deep dives
- Customer & Investor Networks — full relationship mapping
- Sankey, Chord, Marimekko — advanced flow analysis
- Parallel Coordinates, Box Plots, SPLOM — statistical views
- Velocity Map — funding momentum & growth signals
- Financial Heatmap — scoring heatmap across cohort
- All quarterly Market Intelligence Reports during subscription
- Chart exports and aggregated-table downloads
- Quarterly strategy session (up to 3 participants)
Institutional
Larger teams · Broader rights
Annual contract — negotiated per engagement
- Everything in Strategist Team
- Expanded user count (20, 50, or unlimited — scoped per contract)
- Broader internal distribution rights
- Quarterly strategy sessions — larger meeting participation
- Dedicated account manager
- Priority data requests and custom segmentation
- Invoice billing — no credit card required
- Custom onboarding workshop
- Optional: direct data extracts (scoped separately)
- Optional: recurring data feeds and API access (scoped separately)
Advisory & Data Partnership
Custom research · Bespoke deliverables · Data licensing
Custom retainer or project engagement
- Custom research scope and bespoke analytical deliverables
- Direct database access and recurring data feeds
- Structured as retainer or project engagement
- Direct access to Michael Finocchiaro
- Priority data requests and dedicated support
Why ThreadMoat Data Is Different
No LLM can replicate this. No general database covers this niche. Three structural advantages that compound with every quarter.
Quarterly Cohort Refresh
New startups, exits, and funding events added every quarter. Your view of the market is never a year stale. Subscribers always work from the current cohort, not a snapshot. The data you buy today will be refreshed in Q3 2026.
Proprietary 7-Dimension Scoring
Each company is rated across Market Opportunity, Team Execution, Funding Efficiency, Growth Metrics, Technical Differentiation, Industry Impact, and Competitive Moat. Rated by a single analyst, consistently, since 2022. That continuity is the signal.
PLM-Native, Not Scraped
Crunchbase has 3M companies. We have 700+ that actually matter in engineering software. Every entry is hand-curated by a domain expert who spent 30 years inside the vendors being disrupted.
See what you get
Sample dashboard views and analyst briefing outputs.
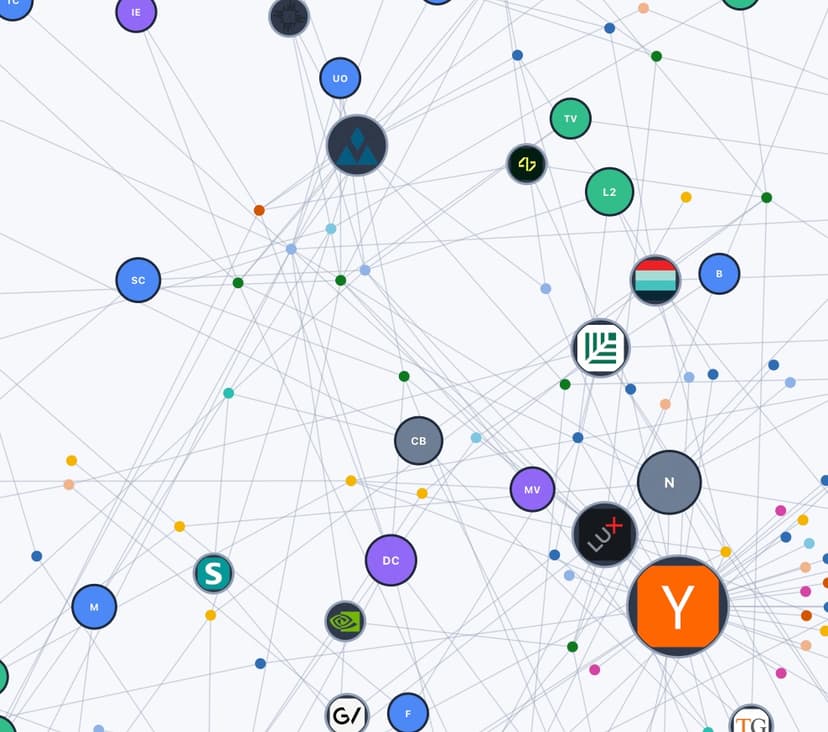
Investor Network
Interactive network graph mapping investors, portfolio companies, and co-investment relationships
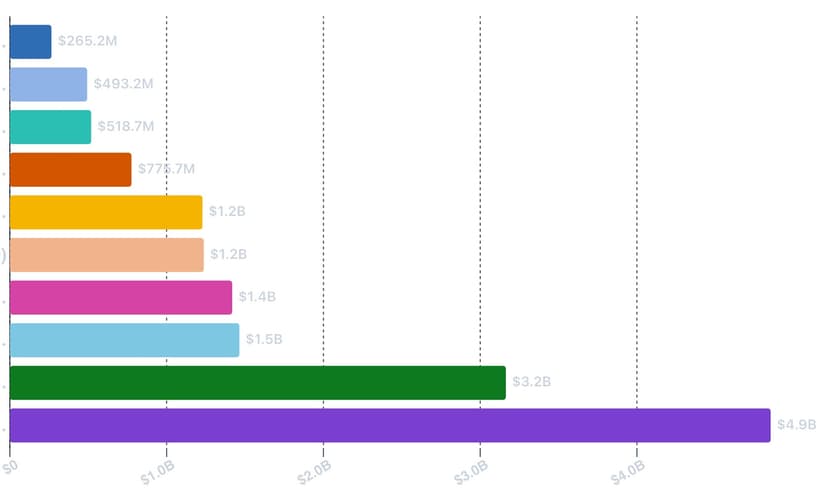
Funding Distribution
Bar chart of companies by funding stage (Seed to Series D+) with total capital deployed
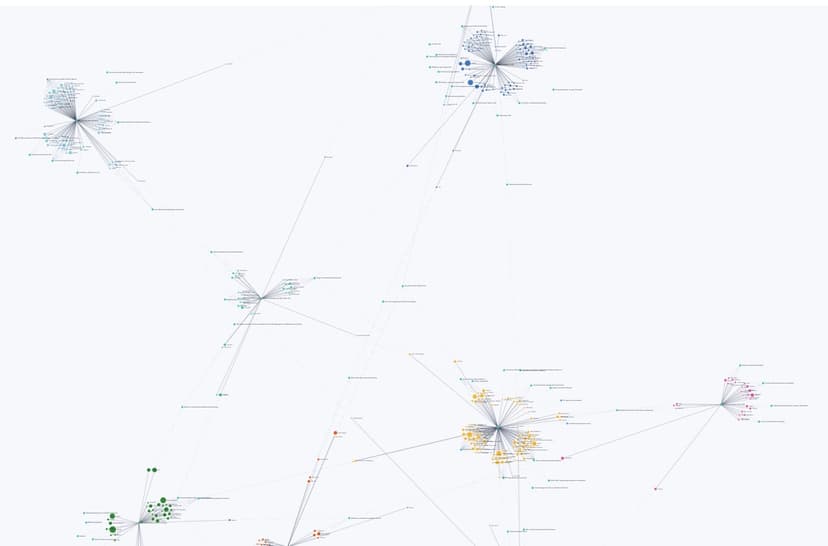
Discipline Breakdown
CAD / CAM / PLM / ERP / Industrial AI by headcount and funding — full ecosystem view
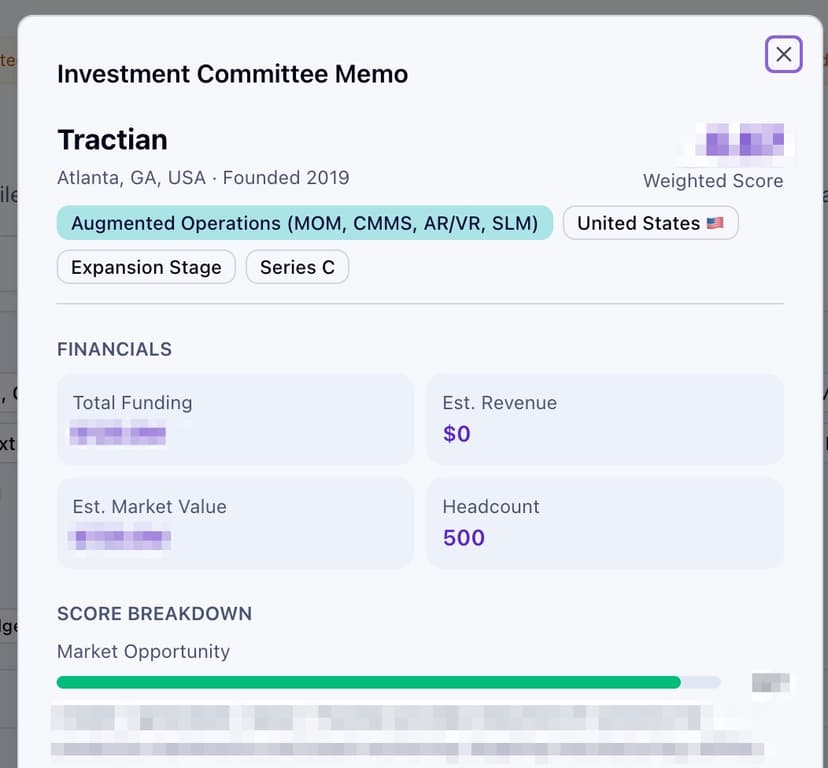
Analyst Briefing
Investment Committee Memo with scoring breakdown, financials, and competitive analysis
What we track
Every company is profiled across six dimensions — updated weekly by a single domain expert, not scraped or AI-hallucinated.
Company Profile
- Name, URL, HQ location, country, founded
- Estimated headcount
- Known customers
Market Position
- Discipline (CAD, CAM, PLM, ERP...)
- Lifecycle phase & workflow segment
- Sector focus & industries served
Technical Stack
- Differentiation tags
- Deployment model (Cloud, On-Prem, Edge, Hybrid...)
- Operating model (SaaS, B2B, Direct Sales...)
- Manufacturing type & integration points
Financials
- Latest funding round & year
- Total known funding level
- Estimated revenue & market value
Investment Context
- Investors & VCs
- Investment list membership
- Stripe customer & buyer maturity signals
Competitive Scoring
- Market Opportunity
- Team & Execution
- Funding Efficiency
- Growth Metrics
- Technical Differentiation
- Industry Impact
- Competitive Moat
- Weighted score (0-10)
Frequently Asked Questions
What is included in the Analyst plan?▾
Analyst (€5,000 one-time) gives one legal entity permanent access to the current-quarter Market Intelligence Report, 10 interactive analytics views, and a 60-minute analyst briefing. It does not include advanced statistical views, multi-user access, or ongoing report updates — those are Strategist features.
What is included in Strategist Team?▾
Strategist Team (€20,000/year) covers up to 5 named users at a single legal entity. It includes all Analyst analytics plus 15 advanced views (Velocity Map, Financial Heatmap, Parallel Coordinates, and more), all quarterly Market Intelligence Reports published during the subscription year, chart and aggregated-table exports, and a quarterly strategy session with up to 3 participants.
What does Strategist Institutional add?▾
Strategist Institutional (from €50,000/year) extends Team rights to larger user counts (20, 50, or unlimited), broader internal distribution, larger strategy-session participation, a dedicated account manager, and priority data requests. Direct data extracts, recurring data feeds, and API access can be scoped as optional add-ons within an Institutional contract.
How are users licensed?▾
Analyst is a single-entity licence for individual or team-internal use. Strategist Team covers up to 5 named users. Strategist Institutional scales to 20, 50, or unlimited users depending on the contract. If your requirements exceed Team scope, contact us for an Institutional quote.
Are data extracts or API access included in Strategist?▾
No. Standard Strategist subscriptions include chart exports and aggregated-table downloads. Direct database extracts, recurring data feeds, and API access are available as optional add-ons within Institutional contracts or as part of a custom Data Partnership engagement.
Are startups eligible for adjusted pricing?▾
Early-stage startups may qualify for adjusted Analyst pricing. This is handled case by case — contact us to discuss your situation.
Can we use the reports internally across a large organisation?▾
Analyst and Strategist Team are licensed for the named users at a single legal entity, with standard internal use rights. If you need broader distribution across business units, subsidiaries, or a larger group, that falls under Strategist Institutional or a custom Data Partnership. Contact us to scope the right arrangement.
Is there a free version?▾
Yes. Explorer is a permanent free tier with no credit card required. It gives access to 3 interactive views — the Ecosystem Graph, Market Segmentation, and Geography Map — plus company profiles for the full dataset.
When should we discuss Advisory or a Data Partnership?▾
If your work requires custom research scope, bespoke deliverables, direct database access at scale, or a recurring data feed integrated into your own workflows, those are structured as custom engagements outside the standard subscription tiers. Reach out via the contact page and describe your use case.